Introduction
- An advanced meditator enters and remains in the Jhanas for a certain amount of time (5 mins each approximately), as it is described in the famous MN 111 Anupada Sutta as a progression from the rupa Jhanas to the Arupa Jhanas
- As one of the first scientific recording of Nirodha, cessation of perception and feeling, the advanced meditator can by pre-determination remain in Nirodha for about 5 mins and fall back into the realm of Arupa Jhanas.
EEG Data
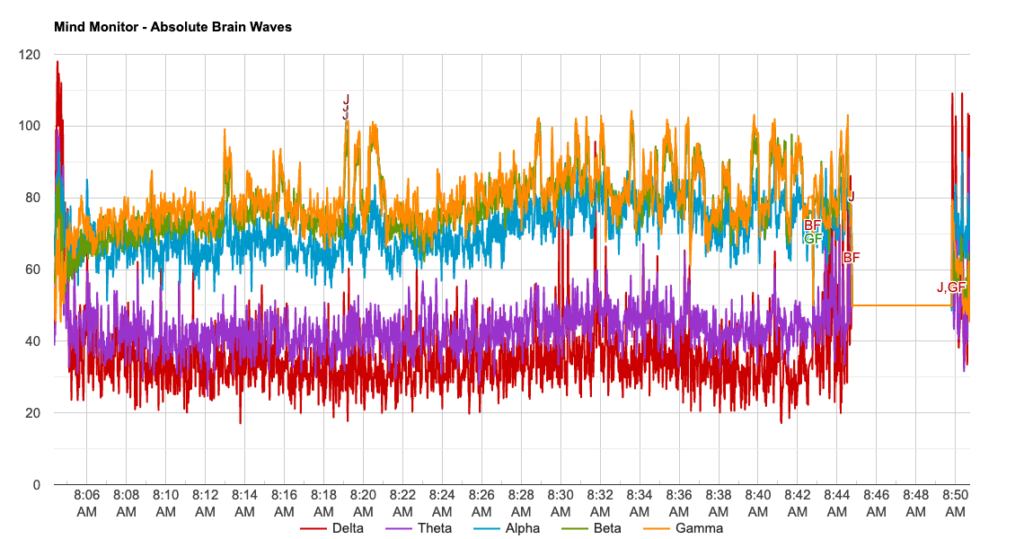
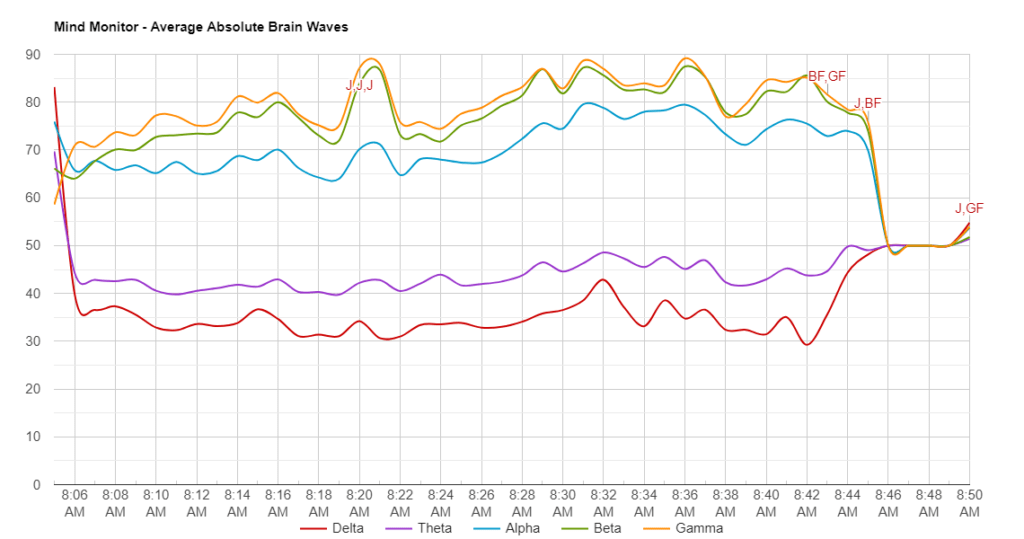
Data was collected from one individual who used the Muse EEG device between 08:04 – 08:50 (~ 46min). Approximately every 5 minutes a Jhana state was achieved until reaching Nirodha. In this study only the highlighted information in the table below was considered (Jhana 2 -Jhana 8).
| Timestamp | Sec | State | Start (sec) | End (sec) |
| 08:04:20 | 00:00:00 | start + Jhana1 | 0 | 335 |
| 08:09:56 | 00:05:36 | Jhana 2 | 336 | 635 |
| 08:14:56 | 00:05:00 | Jhana 3 | 636 | 935 |
| 08:19:56 | 00:05:00 | Jhana 4 | 936 | 1235 |
| 08:24:56 | 00:05:00 | Jhana 5 | 1236 | 1535 |
| 08:29:56 | 00:05:00 | Jhana 6 | 1536 | 1835 |
| 08:34:56 | 00:05:00 | Jhana 7 | 1836 | 2135 |
| 08:39:56 | 00:05:00 | Jhana 8 | 2136 | 2435 |
| 08:44:56 | 00:05:00 | Nirodha | 2436 | 2735 |
| 08:49:56 | 00:00:36 | Jhana 8 | 2736 | 2772 |
Brain wave values are absolute band powers, based on the logarithm of the Power Spectral Density (PSD) of the EEG data for each channel.
The frequency spectrums of these are:
| Name | Frequency Range |
| Delta | 1-4Hz |
| Theta | 4-8Hz |
| Alpha | 7.5-13Hz |
| Beta | 13-30Hz |
| Gamma | 30-44Hz |
EEG Feature Extraction and Classification Pipeline
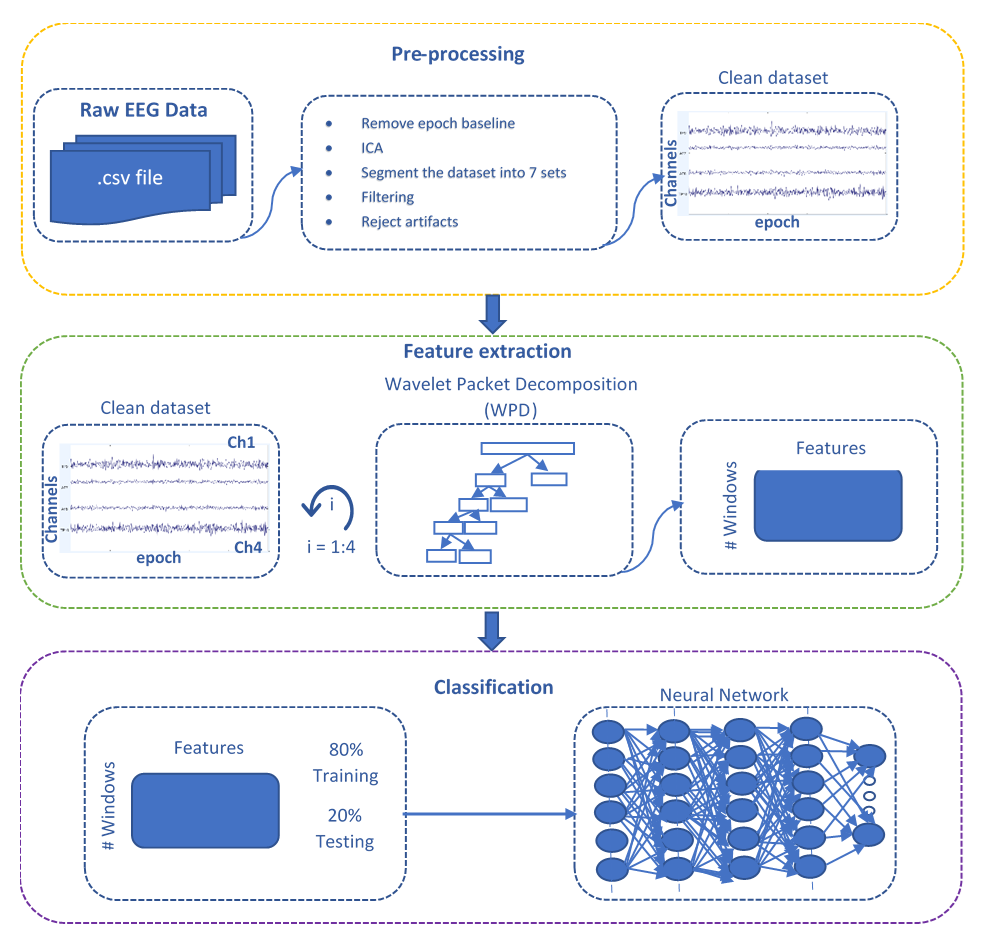
The following pipeline consists of a pre-processing step applied over raw EEG data to clean and remove noise/artifacts, followed by feature extraction using Wavelet Packet Decomposition (WPD), and lastly feeding a neural network with the generated features to perform classification.
Data preparation
For this study, an EEG dataset was recorded using a muse device for ~46 min of continuous data. The muse records EEG data at 256 Hz. The data was pre-processed using EEGLAB. It was segmented into 7 sets, each with a duration of 5 minutes. In total, 7 classes were defined for classification (each class corresponds to a Jhana).
This is the power spectrum of the 7 sets at the range of interest 0-40 Hz.

Feature Extraction and Classification
Wavelet Packet Decomposition (WPD) + 5 dense layers
Wavelet transform is a good tool for the analysis of non-stationary signals like EEG because for this type of signals it is not sufficient to perform a transformation from time to frequency domain, it is also required to know the time domain information associated to the frequency domain, thus a time–frequency representation is essential in order to derive meaningful features. WPD’s ability to decompose a signal down to its frequency components shows that it is a simple and direct method to analyze EEG signals in different frequency bands representing different activities in the brain.
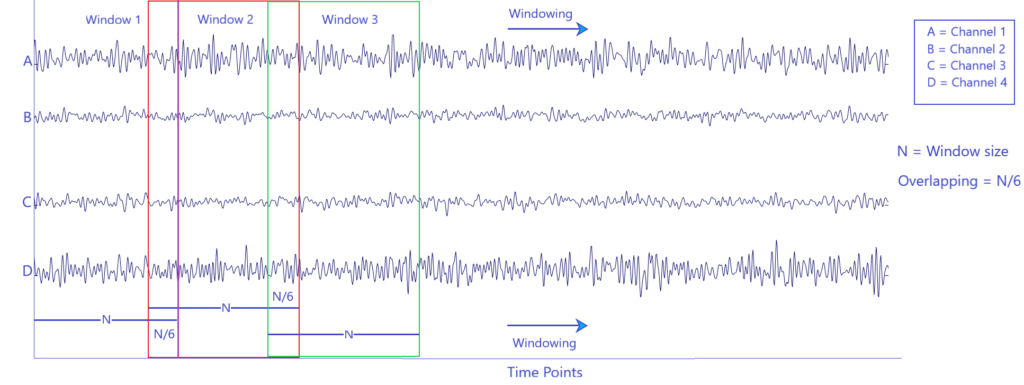
The raw EEG signals (time points x channels) were decomposed into sub-band frequencies by using Wavelet Packet Decomposition (WPD). The signals were divided into multiple windows of size 256 (1 second) with overlapping (see figure below), and the Daubechies 4 (db4) was chosen as mother wavelet with a level of decomposition of 4.
Windowing of raw EEG data
WPD Level 4 of Decomposition
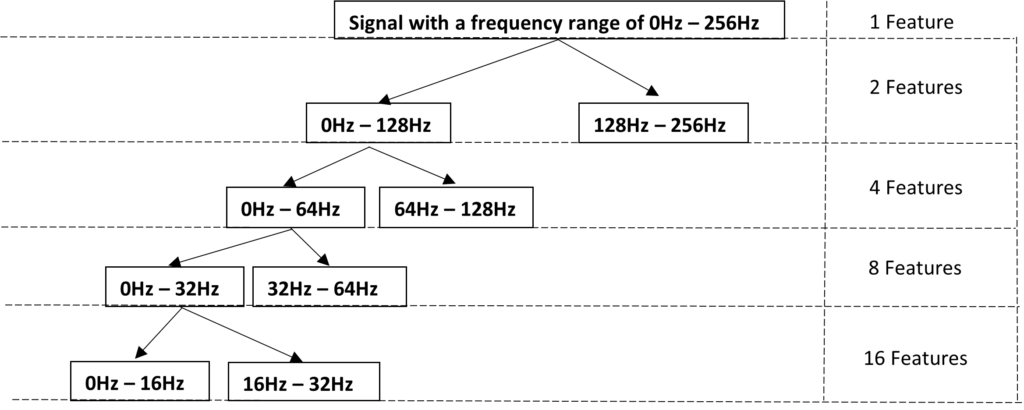
Each decomposition level indicates a band of frequency. If you increase the no. of decomposition levels, then each band will be narrower which means you will have better frequency resolution.
The resulting feature vector has 31 features (adding up all the features among the previous levels) corresponding to the level of decomposition 4. This is applied to each EEG channel, generating 124 features per window. The extracted features were split in 80% and 20% per set for training and testing, respectively to feed a neural network model of 5 dense layers .
Classification results
This classification process was applied to extracted features from all the wavelet decomposition levels. The highest classification performance was found at the level of decomposition 4. The classifier achieved 77.18% of accuracy. This shows it is able to find some discrimination between the Jhana states at the EEG level.

The confusion matrix shown in the figure above shows that the neural network could classify correctly testing samples from class 2 and class 7, while still struggling with the other classes.
Ongoing work
State of the art regarding feature extraction and classification of EEG signals is inclined towards Convolutional Neural Network (CNN) or Recurrent neural network (RNN), or a combination [1]. The time series nature of the EEG data suggests an RNN model (LSTM, GRU or CNN-RNN) should be the more appropriate choice. The accuracy obtained with the features from a traditional method like Wavelet transform imply that a Deep Learning model for feature extraction should achieve better results.
A burden with the current experiments was the low number of channels of the EEG device. The 4 channels of the muse device entailed the use of augmentation techniques to make subsequent feature extraction. Some of the devices found in the literature with higher number of channels are the Emotiv EPOC which was the most common, followed by the OpenBCI, Muse and Neurosky devices. As for the research grade EEG devices, the BioSemi ActiveTwo was used the most, followed by BrainProducts devices [1].
Additionally, it could be considered to perform some transformation of the raw EEG data to fit into well-established pretrained Deep Learning models. Some current projects have converted EEG data into some image representation to make it easier to feed to models like VGG-16 [2] and ResNet-50 [3].
References
- Roy Y, Banville H, Albuquerque I, Gramfort A, Falk TH, Faubert J. Deep learning-based electroencephalography analysis: a systematic review. J Neural Eng. 2019 Aug 14;16(5):051001. doi: 10.1088/1741-2552/ab260c. PMID: 31151119.
- G. Xu et al., “A Deep Transfer Convolutional Neural Network Framework for EEG Signal Classification,” in IEEE Access, vol. 7, pp. 112767-112776, 2019, doi: 10.1109/ACCESS.2019.2930958.
- Yang F, Zhao X, Jiang W, Gao P, Liu G. Multi-method Fusion of Cross-Subject Emotion Recognition Based on High-Dimensional EEG Features. Front Comput Neurosci. 2019 Aug 20;13:53. doi: 10.3389/fncom.2019.00053. PMID: 31507396; PMCID: PMC6714862.

